
Packet capturing is a fundamental component of any network monitoring system. It can provide sophisticated intrusion detection for an enterprise VPN, or help mitigate huge scale DDoS attacks on the web. In a telecom network, it provides, among many other things, the necessary visibility into the traffic in order to detect and root cause any possible scenario that would lead to a disruption in service to our users. It’s a well established space, with tools ranging from dedicated hardware to in-kernel support to even bypassing the kernel itself. Complete solutions that provide full visibility into a telecom network are, unfortunately, either proprietary or insufficient. Particularly, they lack the ability to be reactive at scale, often relying on batch file processing. A robust and responsive monitoring system allows us to be proactive in our response to issues. You can probably guess where we’re going with this: we’ve built our own.
Background
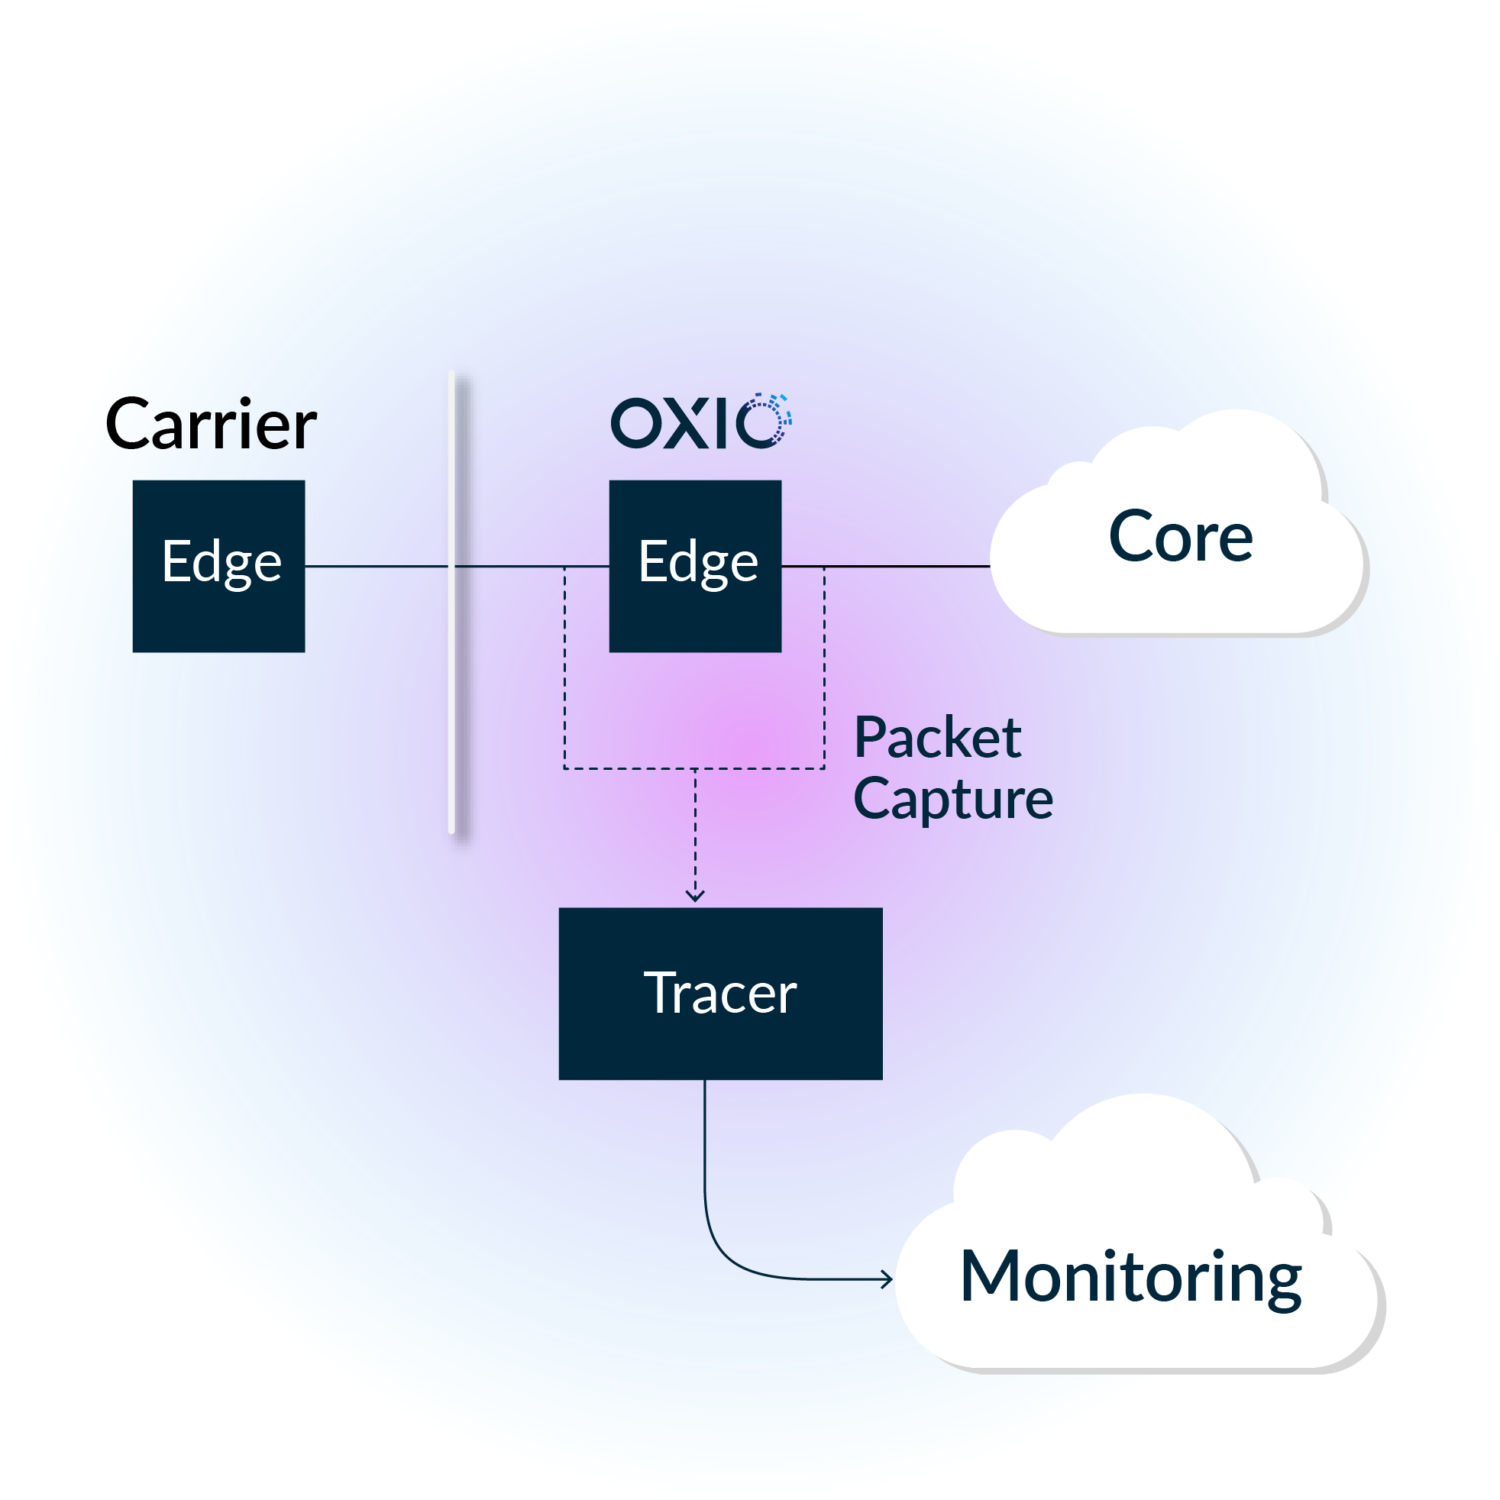
The control plane of a telecom network is built upon the AAA family of protocols. It provides a standard way to regulate who gets access, what they access, and how much they access. This is where we place significant attention, as issues that arise here could lead to service disruptions such as phone calls dropping or internet access getting cut off unexpectedly. A core component of our ability to monitor this is to capture, process, and index each message. This acts as the foundation from which many of our tools for root cause analysis and anomaly detection are built upon. This blog post will primarily focus on the capturing aspect of this system, which we will refer to as the tracer.
Approach
The responsibility of the tracer is quite simple:
-
- Capture all packets on a given network interface
- Classify each to determine where to send it downstream
- Demultiplex them onto an event stream, so that consumers can process them accordingly
What is important is that we do this efficiently with a balance between low latency and high throughput. This component touches every single packet that goes through our control plane edge, and thus dropping packets, e.g. due to slow processing, would mean losing highly valuable visibility into the network.
Rust is a natural choice for this problem. No GC pauses means predictable performance, efficient C bindings allow us to reuse existing mature software that already solves subsets of the problem domain (e.g. libpcap), and we can ensure memory-safety using its rich type system and borrow checker. Performance is what really matters, and because modern processors rely heavily on CPU caches to prevent expensive memory stalls, our first goal is to be completely zero-copy and zero-allocation on the hot path. There are many other avenues for maximizing CPU performance, such as reducing data dependencies to improve instruction pipelining, which we will tackle in the future.
Capturing
Capturing packets off the network interface is done using libpcap, the underlying library behind the standard tcpdump tool. It gives us some very useful features out of the box, namely capturing filters and buffering. Plus, by using the libpcap rust bindings crate, we’re able to integrate rather quickly. However, there is room for improvement here; libpcap works by copying the data from kernel to user space (ok so our current implementation is not truly zero copy… yet), which could end up being our bottleneck. There are a few alternatives to bypass this. Netmap, PF_RING, and DPDK are all popular frameworks for working directly with the NIC. We plan on evaluating these options in the future.
Classifying
In our 4G and IMS core networks, the network elements all communicate over the Diameter application layer protocol. It provides the base for various reference points to be standardized on. Each reference point plays an important role in the network’s overall ability to provide service to users, e.g. providing credit control for voice, SMS, and data. The tracer’s job is to classify the Diameter traffic to its respective reference point allowing us to pinpoint the impact and scope of any issues that arise. To do so, we look at various packet headers, such as the IP source and destination addresses, but notably, we also need to look in the payload (i.e. DPI). The structure of a Diameter packet is as follows:
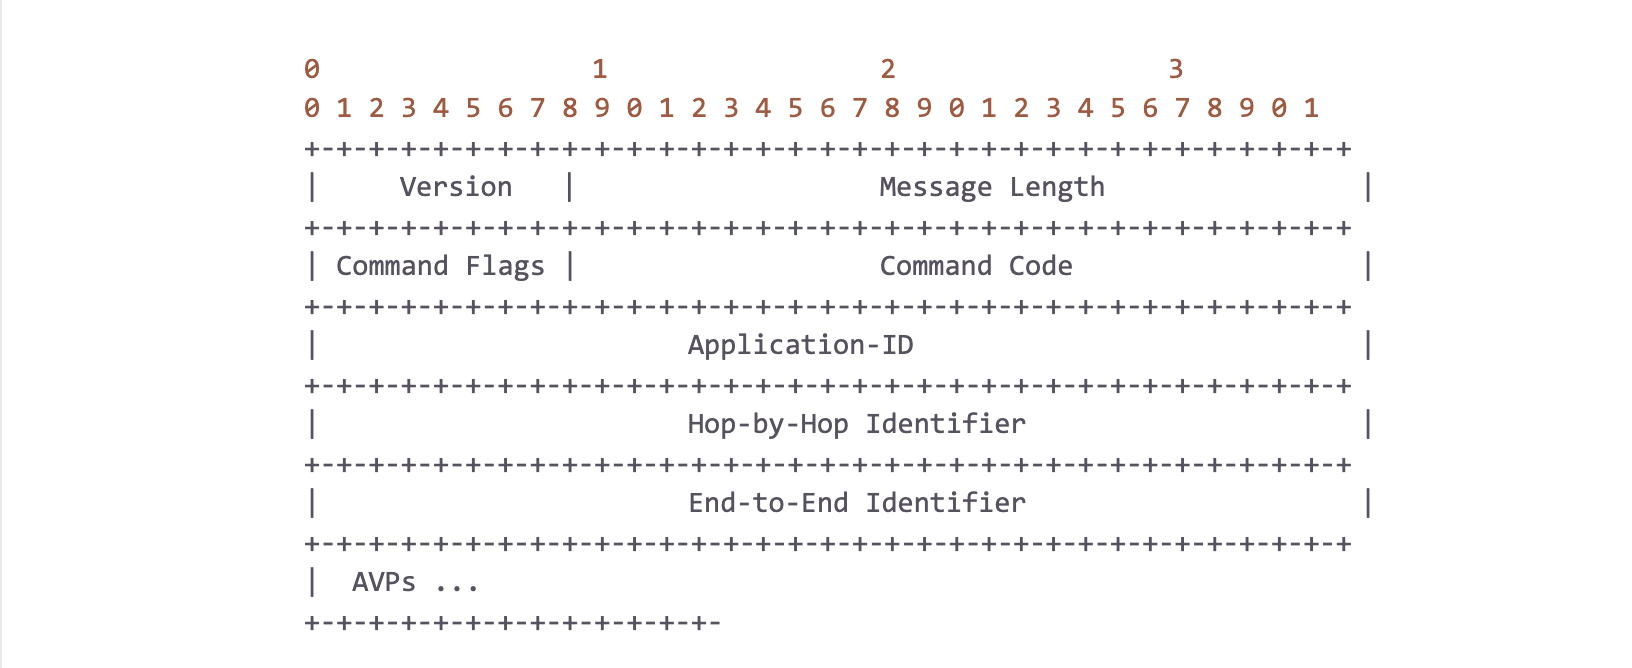
Simply put, a Diameter packet is just a 20-byte header followed by a variable sized list of “AVPs” (Attribute-Value Pairs), where a single AVP is defined as:
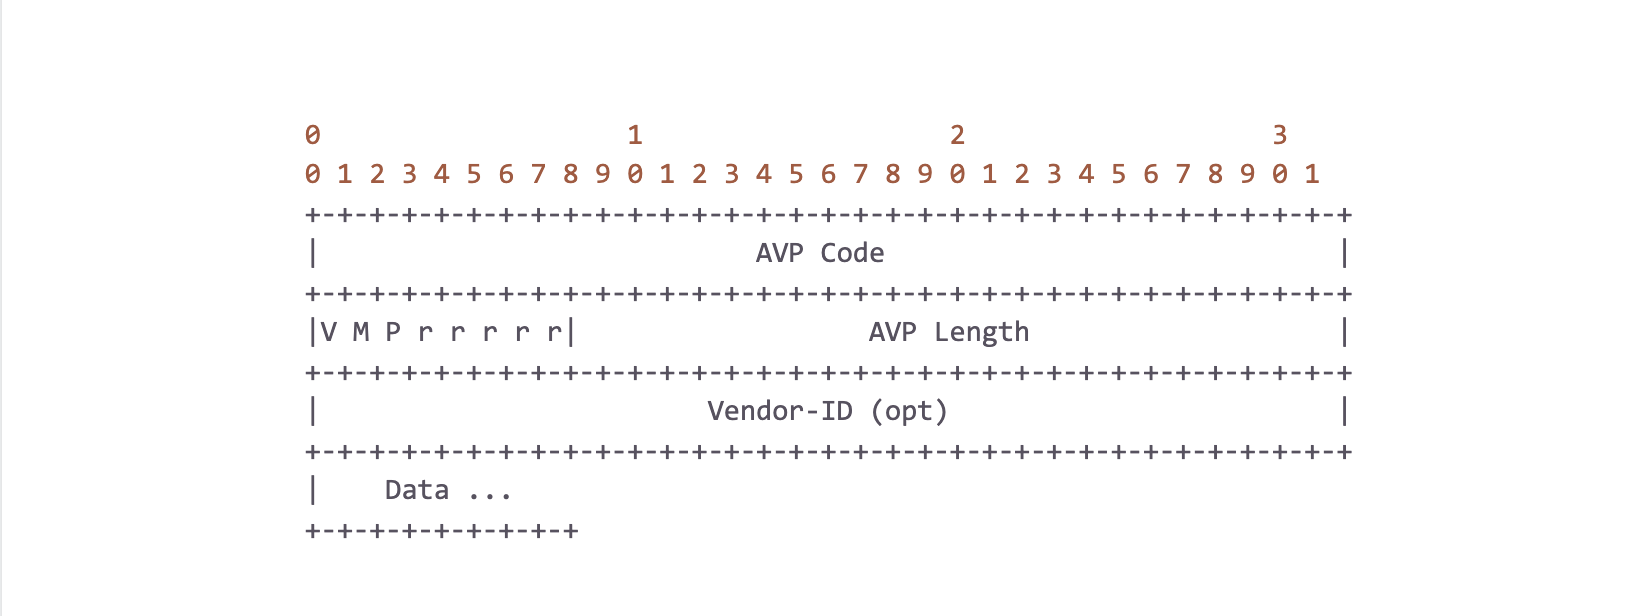
One thing to highlight is that an AVP’s data can, and oftentimes does, contain another AVP! In other words, AVPs can be nested, and their path has semantic meaning. For example, an AVP with code `C` at `A -> B -> C` is not the same as `D -> B -> C`. It is also important to note here that there is no type information of the data encoded in the header. Diameter implementations must keep a dictionary which provides this type information as defined by the standards.
With that out of the way, we can now go into how to parse these messages efficiently. To parse each packet layer, we use the pnet crate which provides utilities for standard L2/L3 protocols. Additionally, it provides the #[packet] macro which allows us to easily generate zero-copy parsers for Diameter and SCTP (transport protocol commonly used in the industry). That takes care of the various packet headers for us, and now we just need to focus on the Diameter AVPs.
Since we’re using Rust and GATs haven’t stabilized yet, in order to maintain zero-copy, we unfortunately cannot implement the std::iter::Iterator trait which would give us all the convenience methods associated with it. Instead, we need to implement a custom streaming iterator which borrows from the underlying memory (we’re very excited for GATs to finally land in the near future!). There are two other possibly expensive operations as we parse the AVPs: path tracking and the dictionary lookup to obtain type information.
AVP Path Tracking
Given the definition of an AVP above, we can model the AVP list as a general tree and track the path of each node through a depth-first traversal.
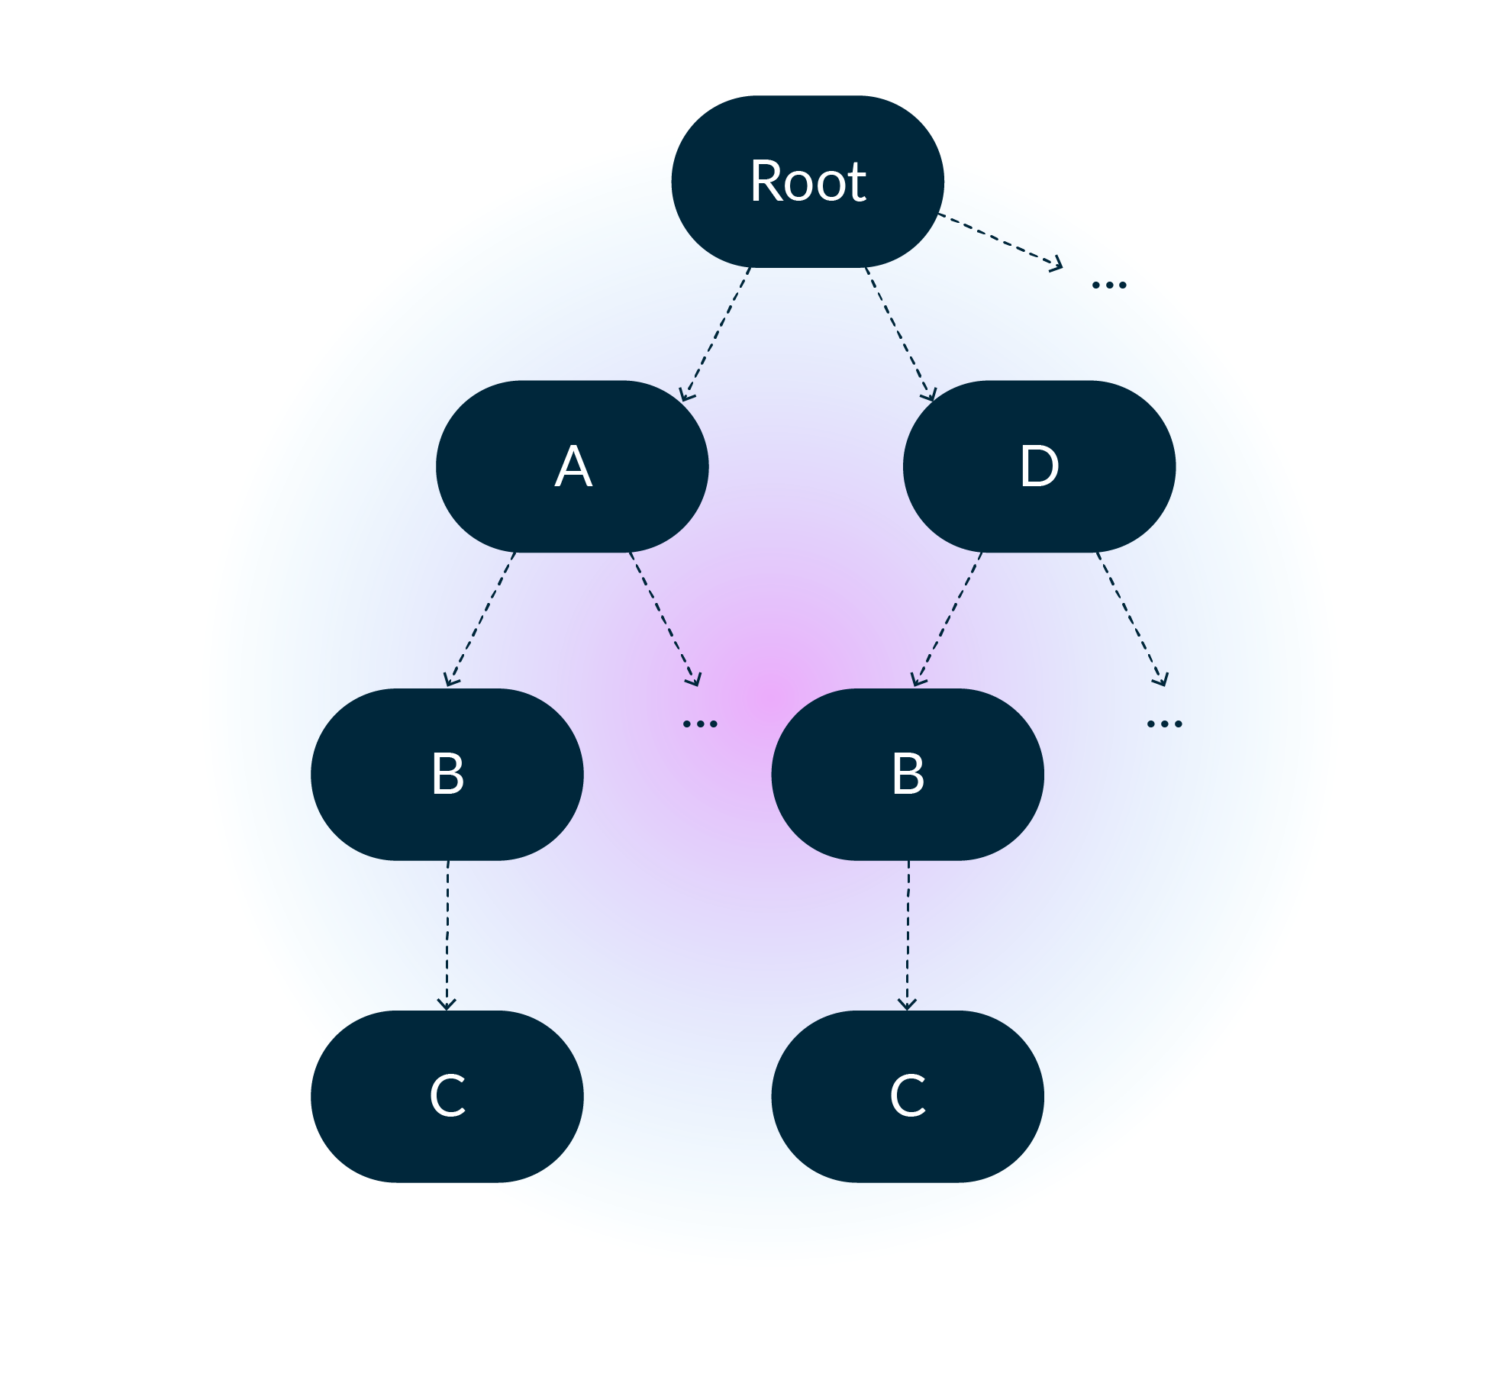
And in memory it looks like:
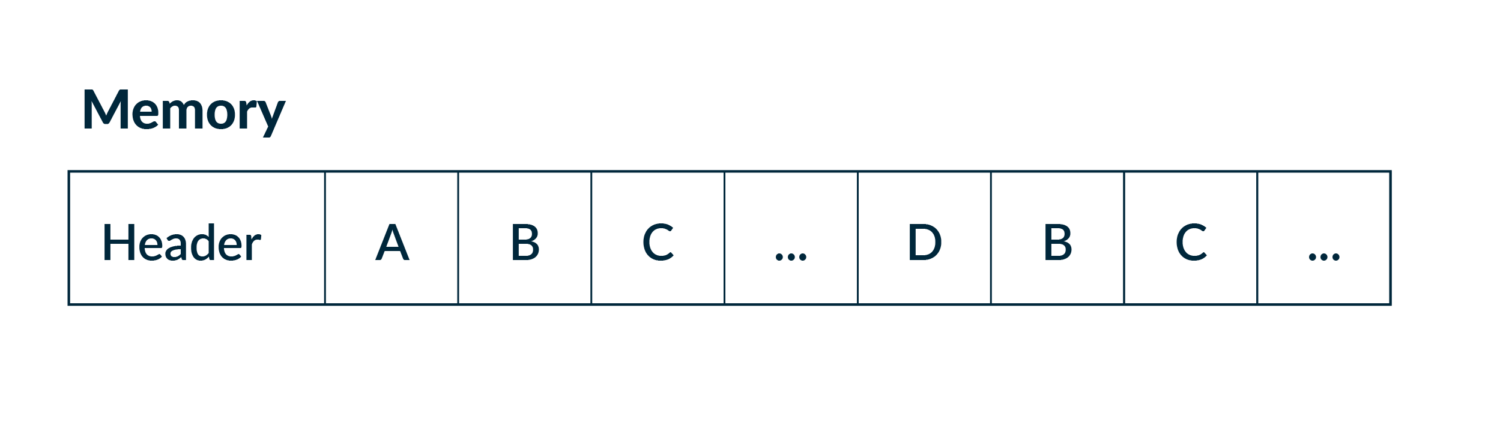
A very fine detail here is that in addition to depth-first being the intuitive algorithm, it also has the benefit of being very friendly to the CPU pre-fetcher, as it walks the array-backed tree in pre-order which is just scanning the array from start to end. In theory, trees do not have a maximum depth. This means we’d need to use a growable (read – heap allocation heavy) data structure. However, in practice, we sampled production traffic to get an upper bound for path depth, which at the time of writing is only 6. It’s a more than reasonable value for applying the Small Size Optimization. We stack allocate a fixed sized vector of 6 and only pay for a heap allocation in the rare case of outliers! Of course, Rust has a crate for this already. Thanks to Servo’s smallvec crate, this optimization is only an import and a few small code changes away.
Dictionary Lookup
The current default hashing algorithm used by the standard library’s HashMap is SipHash which is a DDoS resistant hashing algorithm. This has good collision resistance properties and protection against HashDoS Attacks but is unnecessary for our use case. The tracer is a passive observer of the network after all. Moreover, the keys into our hashmap are the AVP’s code and vendor id, which are a pair of unsigned 32-bit values. There are a large variety of hashing algorithms, some of which are specialized for certain key types. Switching to FxHashMap gave us a roughly 2.5% performance improvement. Not as significant as we expected, but still an improvement nonetheless! It also essentially removed hashing from our CPU profile which got all the low-hanging fruit out of the way, and surfaces further hot spots.
Conclusion
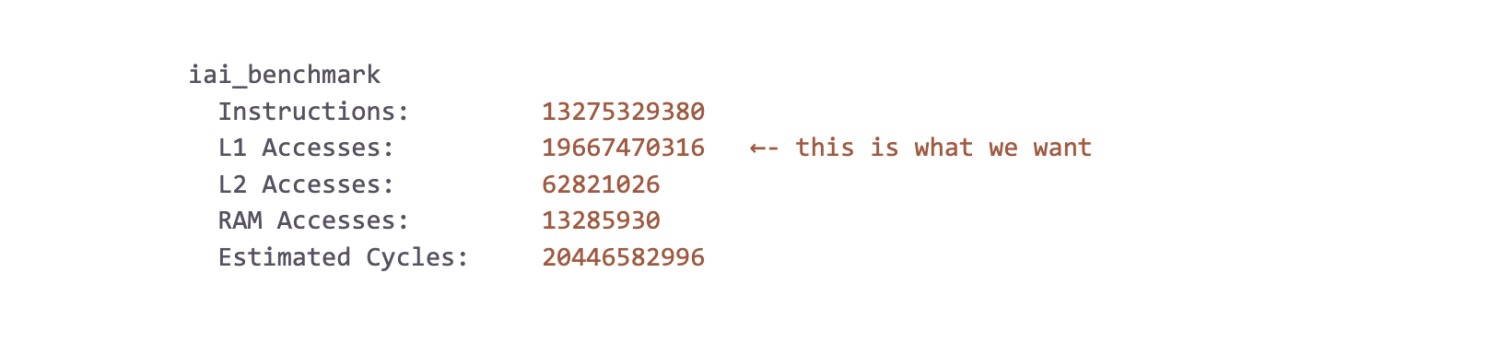
Using the great Criterion and Iai benchmarking crates, we were able to get reliable measurements from our optimizations. Our microbenching workload consisted of loading a few GBs worth of sampled production data into memory and running our classification logic on it. As with all microbenchmarks, we don’t put too much emphasis on the raw numbers themselves. Hardware differences, noisy neighbors in the cloud, running Chrome while running the tests, etc. can all lead to discrepancies between test and production environments. We focus more on the trends and relative numbers across runs to verify if we’re on the right track. That being said, on an AMD Ryzen 9 3950X @ 3.5 GHz, we measured roughly 6.5 Gbps (850 MiB/s). It lands us within earshot of the line rate of a typical 10 Gbps Ethernet port and it is a great place for us to continue to improve upon. The Iai framework proxies CPU cache utilization as a means to measure performance (a L1 cache access is around 2 orders of magnitude faster than RAM). Our results indicate good cache usage, as observed by the relative hit rates per cache level:
Here at OXIO, we really appreciate the open source community, and what it has empowered us to accomplish so far. We would like to contribute back! We plan on open sourcing this work, so if it interests you please follow the blog for more updates.